Corn earworm moth nightly pheromone trap catches ranged from zero to 9 per night this week (here is the Table). Black light traps averaged 1.8 per night in Petersburg and 1.3 per night in Disputanta.
In our corn earworm adult vial tests with the pyrethroid cypermethrin (5 micrograms/vial rate), 62% of moths were dead or knocked down after a 24-hour exposure (64 moths from Suffolk, VA have been tested to date). We will continue to provide weekly updates on trap catches and vial test results.
We hit the tarnished plant bug threshold for the first time this season on July 15 at the Tidewater AREC, in Suffolk. Reports of threshold numbers are rolling in from collaborators as well. Here are a few key reminders for successful plant bug management this year;
1. Use economic thresholds
These economic thresholds are the point at which you will see a return on investment from spraying for plant bugs.
Pre-bloom threshold;
8 plant bugs/100 sweeps AND less than 80% square retention
Many of our cotton fields here on the research farm and in on-farm trials are beginning to flower this week. Once you reach 50% of plants in a field with flowers, switch to using a drop cloth to sample plant bugs. The drop cloth should be placed on the ground between two rows and the plants on either side vigorously beaten over top of the sheet. Take a sample in 6-8 spots throughout a field and average to determine the number of bugs per drop cloth sample. Making the switch from sweep net samples to drop cloth samples during bloom is critical for making informed management decisions on plant bugs.
Threshold from the 1st week of bloom on;
3 plant bugs/5 row feet
Even if you are using a Thryvon cotton variety, it still needs to be scouted and treated for plant bugs at the recommended thresholds. Weekly scouting will provide the best insight on when and where insecticide applications are needed.
2. Insecticide rotation
Hold off on using strong broad-spectrum insecticides until late in the season. These include pyrethroids and organophosphates;
Organophosphates: Bidrin, Orthene
Pyrethroids: Warrior II, Bifenthrin, countless generics (look for insecticide MOA 3A on the label). Many premixed products, including Endigo or Brigadier include a pyrethroid.
Plant bugs have developed resistance to pyrethroids, and these products eliminate beneficial insects, which may keep other pests in check later in the season. An early pyrethroid spray can often flare spider mites, aphids, and bollworms later in the year.
A good option for your first spray for plant bugs is Transform @ 2 oz/ac. Diamond @ 4-6 oz/ac can be included as well, where there are nymphs present. This product is an insect growth regulator and will not have activity for adult plant bugs. If timed correctly, it has been shown to increase the time before another plant bug spray is needed. Neonicotinoids (Centric, Admire) can also be effective early in the season, but need to be combined with other products to get good control as the year progresses. Be sure to check the label for restrictions on use patterns during bloom (e.g., application restrictions because of risk to bees and other insect pollinators).
This week’s corn earworm moth catches ranged from <1 to 13 per night in Virginia pheromone traps. Here is the Table. Also, Scott Reiter is operating two black light traps in Prince George, with nightly catches averaging 2 moths (Petersburg) and 0.7 moths (Disputanta).
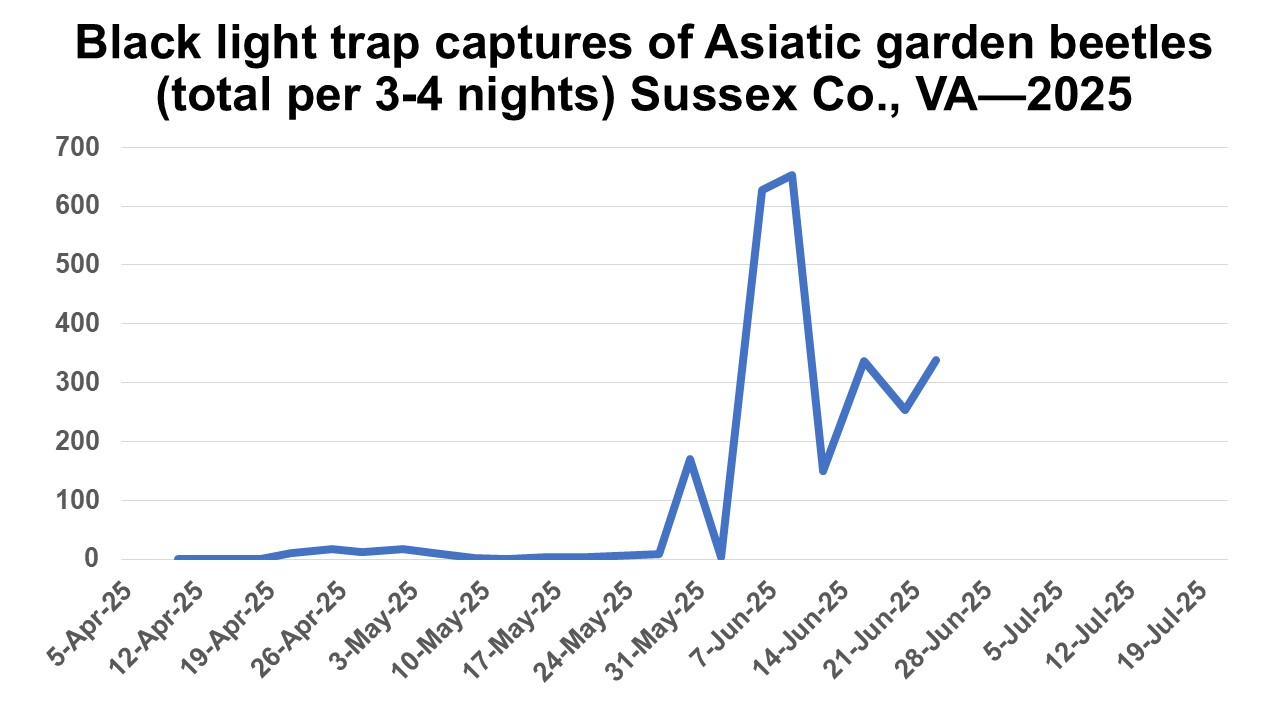
Captures of AGB adults in our Sussex County, VA black light trap dropped sharply in July and we shut down the trap. Here is the graph for the entire season:
Thanks to the folks at this location for allowing us to conduct a second year of monitoring this insect!
Peanuts are growing fast and that first leaf spot spray has been applied or should be soon. Typically folks go with Bravo (1.5 pt), Alto + 1.0 pt Bravo, or Aproach Prima + 1.0 pt Bravo with or without tebuconazole. With the weekly rain and high humidity, conditions for leaf spot are favorable. Some folks are thinking about their second spray pretty soon. Fungicides I like for the second spray are Provysol + tebuconazole, Lucento, Fontelis (1.0 pt) or Miravis. If you have fields with a history of southern stem rot (white mold) you may need to tank mix the leaf spot fungicide with Convoy, Elatus or Excalia or bump the Fontelis rate up to 1.5 pts. I’d plan on the third spray being Bravo at 1.5 pt + tebuconazole or substitute tebuconazole with one of the so. stem rot fungicides above. The fourth spray I like Provost Silver because of it’s “kick-back”/curative activity. The last spray or last two sprays can be either Provost Silver again or Bravo at 1.5 pt + tebuconazole. If you think there may be issues with Sclerotinia blight, Omega/Vantana can be used, preferably at disease onset or before, or a second spray of Miravis + Elatus. Don’t be afraid to use Bravo a couple of times as it doesn’t increase Sclerotinia blight unless it’s sprayed 4-5 times. However, if it turns hot and dry you should avoid Bravo as it can flare spider mites.
Here are our two moth catch tables: June 2025 and July 2025. Some locations averaged over 20 moths per night (Brunswick, Virginia Beach). The Corn Earworm Moth Tracker site is under construction (we are still working out some bugs) and will allow users to filter data by county and date.
Asiatic garden beetle numbers in our Sussex County, VA black light trap dropped this week, with 60 adults total caught in the past 3 nights (Figure below).
Carrie Ortel, Extension Soybean Agronomist, Virginia Tech Tidewater AREC
Mark Reiter, Soils and Nutrient Management Extension Specialist, Virginia Tech Eastern Shore AREC
Joseph Haymaker, Postdoctoral Associate, Virginia Tech Eastern Shore AREC
Many of the full-season soybean fields in Virginia are beginning to flower, which is a great time to start tissue testing if there is a concern for crop nutrition. Tissue testing is an effective way to monitor crop nutrition when done correctly. To get reliable results, choose the correct, uppermost fully expanded soybean leaf during optimal conditions and carefully interpret the results. Tissue testing may begin as early as V4 but is most reliable during flowering and can continue through pod filling.
Step 1: Plan Your Sampling During Good Field Conditions
Time It Right – Field Conditions Matter
Field conditions at sampling time greatly affect the accuracy of tissue tests. Aim to collect samples when plants are actively transpiring, which usually means:
Adequate soil moisture (not drought or waterlogged).
Moderate temperatures and healthy plant function.
Avoid sampling during:
Drought, which can limit nutrient uptake even when nutrients are present in the soil.
Saturated soils, which can temporarily inhibit root function.
Shortly after foliar nutrient applications—wait at least a week and ensure a rain event has occurred to allow nutrients to be absorbed and leaf surfaces to clear.
Address In-Field Variability
Soybean nutrient levels can vary within a field due to differences in soil texture, drainage, or previous management practices. For meaningful results:
Divide fields into management zones based on known variability.
Take one composite sample per zone, collecting at least 18 trifoliolate leaves randomly throughout that area (Ortel et al., 2023).
This helps identify localized deficiencies and supports more precise nutrient management.
Step 2: Collect Your Leaf Sample
Choose the Right Plant Part
To get consistent and accurate results, it’s critical to sample the correct, uppermost fully expanded trifoliate leaf, as nutrient concentrations differ between leaves. The uppermost fully expanded trifoliate leaf is typically located on the second, third, or fourth node from the top of the plant (Figure 1, shown below).
Figure 1. Soybean plant at the full flower (R2) growth stage. The uppermost fully developed leaf is shown as the leaf on the third node from the top of this plant.
Look for the highest leaf that is dark green, full-sized, and has a coarse texture.
Avoid leaves with a velvety feel or are lighter in color than others—these are still developing and can falsely indicate nutrient levels.
Check with your testing lab for specific guidelines. Some labs also recommend sampling the whole plant during vegetative stages or including/excluding the petiole (the stalk attaching the leaf to the stem). Be sure your sampling method agrees with the lab’s interpretation standards.
Collect the Sample Properly
Once you identify the correct leaf, follow these best practices:
Collect 18–25 leaves per sample for a good composite.
Take samples across a consistent management zone (based on yield history, soil type, or other field characteristics).
Place leaves in a paper bag (not plastic) to allow drying and prevent mold.
If your lab uses critical nutrient thresholds without the petiole (e.g., Virginia Tech), remove the petiole before bagging.
Step 3: Interpret Results with Context
Getting accurate lab results is only half the process—understanding them correctly is essential.
Use growth-stage-specific critical concentrations when available, such as potassium in soybean (Slaton et al., 2021). These values indicate the threshold below which yield may be affected.
If no critical values are available, use sufficiency ranges cautiously—they are less precise and based on broader surveys instead of replicated research.
Also, consider nutrient mobility:
Mobile nutrients like nitrogen (N), phosphorus (P), potassium (K), and magnesium (Mg) can move within the plant and are often relocated from leaves to developing seeds and pods (Bender et al., 2015). Lower concentrations in leaves during reproductive stages may not signal a deficiency.
Immobile nutrients like calcium (Ca), sulfur (S), and most micronutrients remain in their original locations and offer more stable indicators.
Although some nutrient deficiencies may not be visually apparent (hidden hunger), only take action with a corrective application of fertilizer if a deficiency occurs. Prophylactic foliar fertilizer applications have not been shown to increase yields (Matcham et al., 2021). When a nutrient deficiency does occur, a corrective application of granular fertilizer should be used to correct macronutrients, while a foliar fertilizer may be used to correct micronutrients.
Take Home Points
Collect a composite sample of at least 18 of the uppermost fully expanded soybean trifoliate leaves from each management zone.
Only collect tissue samples during favorable field conditions and adequate soil moisture.
Consider the plant part collected (petiole included or excluded), growth stage, and nutrient mobility with interpreting results.
Bender, R. R., Haegele, J. W., & Below, F. E. (2015). Nutrient uptake, partitioning, and remobilization in modern soybean varieties. Agronomy Journal, 107(2), 563–573. https://doi.org/10.2134/agronj14.0435
Matcham, E. G., Vann, R. A., Lindsey, L. E., Gaska, J. M., Lilley, D. T., Ross, W. J., Wright, D. L., Knott, C., Lee, C. D., Moseley, D., Singh, M., Naeve, S., Irby, J. T., Wiebold, W., Kandel, H., Lofton, J., Inman, M., Kleinjan, J., Holshouser, D. L., & Conley, S. P. (2021). Foliar fertilizers rarely increase yield in United States soybean. Agronomy Journal, 113(6), 5246–5253. https://doi.org/10.1002/agj2.20889
Ortel, C. C., Roberts, T. L., Hoegenauer, K. A., Poncet, A. M., Slaton, N. A., & Ross, W. J. (2023). Mapping variability of soybean leaf potassium concentrations to develop a sampling protocol. Agrosystems, Geosciences and Environment, 6(4). https://doi.org/10.1002/agg2.20439
Slaton, N. A., Drescher, G. L., Parvej, R., & Roberts, T. L. (2021). Dynamic critical potassium concentrations in soybean leaves and petioles for monitoring potassium nutrition. Agronomy Journal, 113(6), 5472–5482. https://doi.org/10.1002/agj2.20819
June corn earworm moth captures in our pheromone trap monitoring network are provided in this Table. Please note that new locations across Virginia have been added this week.